Folio 86 – a map? A discussion by Marco Ponzi
I am delighted to publish the following fascinating and insightful discussion sent to me by Marco Ponzi:
Marco Ponzi April 2015
The Rosettes page f86v lower left diagram The so-called Rosettes page is a large and complex diagram, composed of nine major circular elements disposed in a 3×3 grid and other minor elements of different shapes. Here I will only discuss the circle in the lower left corner of the diagram. It seems likely that this circle is a map of a specific geographic region. In my opinion, the identification of the region illustrated by the map and the phonetic reading of the labels that appear on it could confirm each other and provide significant support for the linguistic theories proposed on this site.
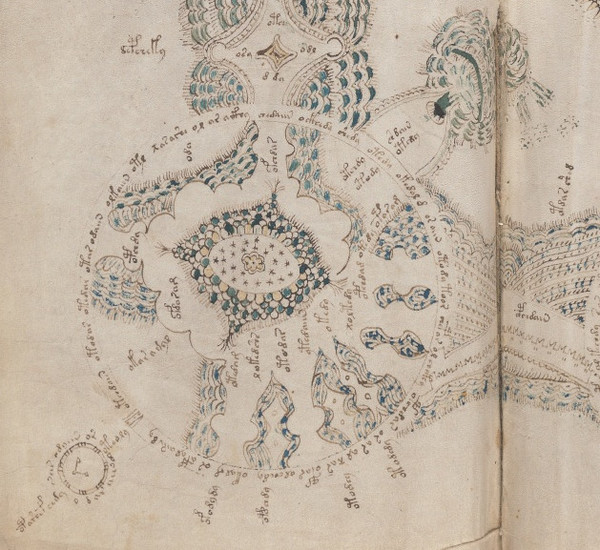
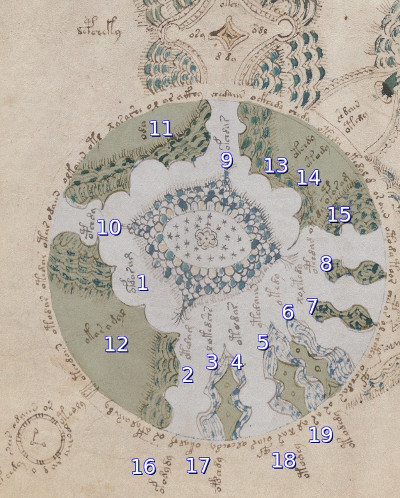
The scalloped plateau (Jorge Stolfi / René Zandbergen) A detailed description of the Rosettes page and a complete EVA transcription are available onZandbergen’s site The lower left diagram is here called “the SW rosette†and described in these terms: Inside the text ring is a “plateau” with scalloped boundary, with 8 extensions or “passages” leaving in different directions. […] The passages are flat like the plateau but are surrounded by several wavy lines, suggesting cliffs. […] Inside the scalloped area there is an elliptical “flower bed” surrounded by a band of scales fpwin gr. At the four cardinal points, the scales pile up into four fountains, whose jets point at nothing in particular. The flower bed is filled with 24 tiny flowers or stars. In the center there is a flower-like object with 6 round “petals” and a doubly-traced outline. There are several labels (unit “B1”) on or near this rosette. One label in the scalloped-outline area, at 07:30, seems associated with the area itself, or the flower bed inside it. Another 9 labels seem associated with the 8 “passages” leaving the scalloped area, and perhaps with the fountains at the corners of the flower bed. Two more labels lie on the “sea”, between the text ring and the scalloped area, at 08:00 and 11:00. When transcribing the labels, Stolfi/Zandbergen refer to the upper and left closed areas as “baysâ€. They also mention a “stream into [the] SW rosette from [the] small island at 01:30â€. The overall impression is that geographical terms (plateau, cliffs, sea, bays, stream) are only used as a metaphor 외부코덱 다운로드. Anyway, reading this description one could understand the diagram as an island or a peninsula surrounded by sea areas.
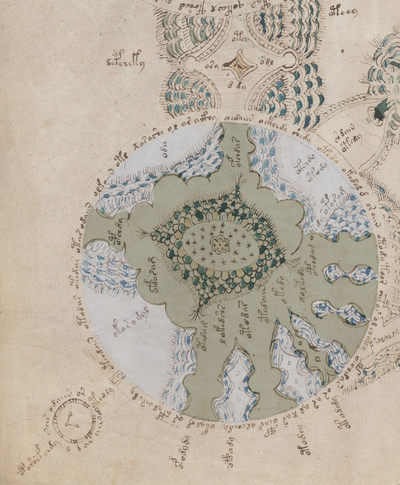
The Great Sea (Diane O’Donovan) As part of an extensive analysis of the whole Rosettes diagram, Diane O’Donovan has devoted two posts to the discussion of the lower left diagram (that she calls “the South roundelâ€): post 1 post 2 She writes that: This roundel represents what Ibn Majid called simply ‘The Great Sea‘ meaning all the waters stretching east and south from modern Suez. … [The roundel contains] a central sea bordered by various irregular inlets and estuaries. … it could be argued that the Bay of Bengal was the map’s centre, but I think it better to leave the question open rather than express any certainty on the point. Diane explicitly interprets the diagram as a map. She identifies a broad geographic area as related to it. She also states that the center of the roundel is a sea area (not land, as in the metaphorical description by Stolfi / Zandbergen).
The fourth continent (Juergen Wastl and Danielle Feger) Wastl and Feger (“VM408 folio86v ‘The Rosette Map’: Elements of a Mappa mundi and a map of the Elementsâ€) also propose an overall analysis of the whole page. The lower-left diagram is explained as: the fourth continent in the making by mixing the elements. This interpretation seems also to be geographical, but no detail is given about the internal structure of the diagram and the features of the fourth continent, what is land and what is sea (or what is earth and what is water, speaking of different “elementsâ€) Download the baseball game.
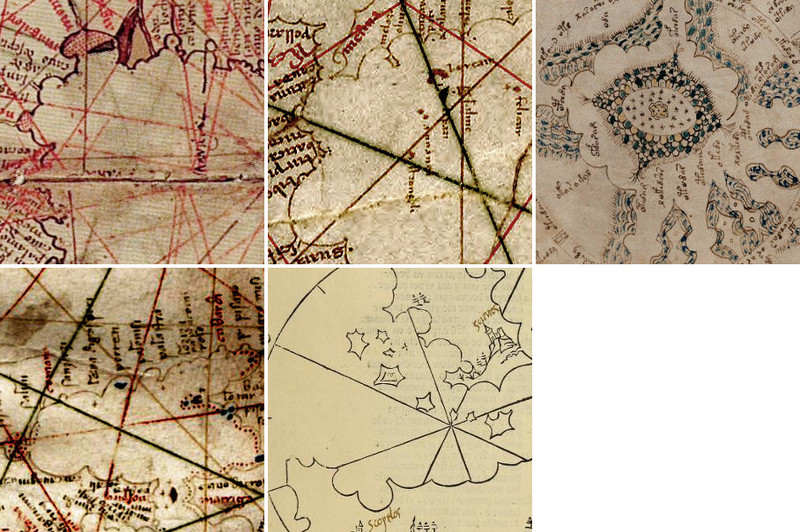
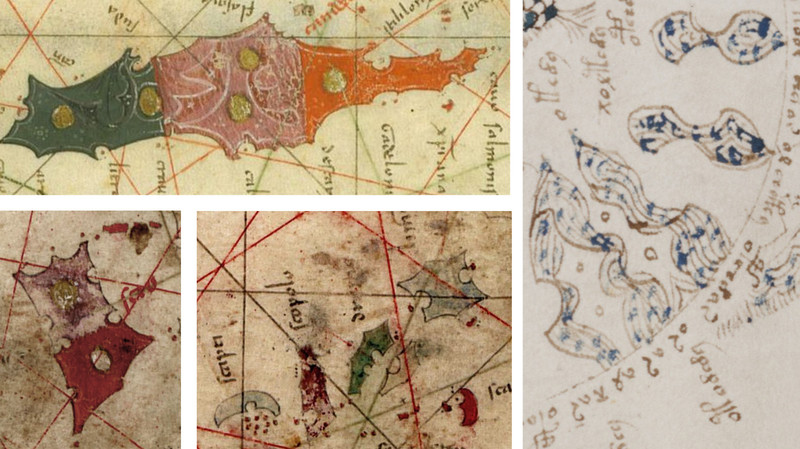
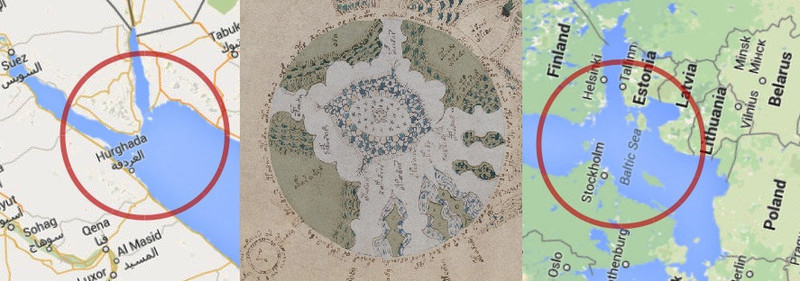
Land or Sea? Given that a map is the interpretation that typically comes to mind to people looking at this diagram, which part of it is land and which is water? Stolfi/Zandbergen and Diane O’ Donovan interpret land and sea in opposite ways. Luckily, this question has a clear answer. In ancient maps, coastlines are often drawn as scalloped lines meant to represent a sequence of crescent-shaped bays (concave towards the sea). This style can already be observed in the maps by Petrus Vesconte (early XIV Century) and was very common during the XV and XVI Centuries. If the lower-left circle of the Rosettes page represents a map, the central area corresponds to the sea. The scalloped lines noted by Stolfi / Zandbergen are a significant support for the hypothetical identification of this diagram with the map of a coastal region. Also the textual labels associated to so many details of the diagram suggest that it is map. Among the atlases representing coastlines in this style, the Isolario by Bartolomeo dalli Sonetti (1485) seems particularly interesting: circular compasses surround the maps, vaguely resembling the circular frame of the Voynich “map†원랜디 8.5 다운로드. The following image includes details from: 1) Petrus Vesconte 1325 2) Anonymous Genoese 1350 ca 3) Voynich Manuscript 1404-1438 4) De Virga 1409 5) Delli Sonetti 1485
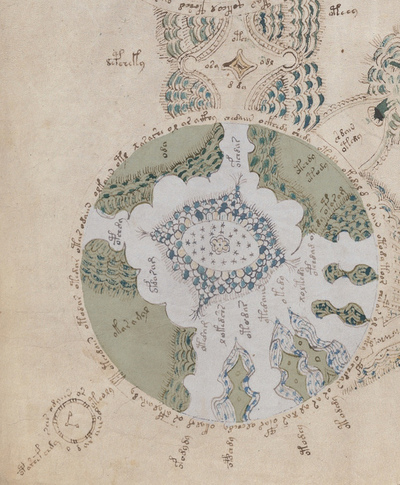
Stylized islands If the center of the diagram corresponds to the sea, the “objects†on the lower-right border of the circle might be islands. They are strange islands, since they have all more or less the same symmetrical shape. But ancient maps often feature stylized islands with unnaturally regular shapes. Islamic maps conventionally represented islands as circles (Indian Ocean – Book of Curiosities XI Century). Islands can also be decorated with arbitrary patterns (Catalan Atlas, 1375). The Catalan Atlas also has some islands shaped as half circles. The blue circle on the right with eight smaller circles inside it might be an archipelago. It could be a parallel for the small circles that appear in the leftmost islands of f86v left-lower diagram 노골 쏭 다운로드. But possibly the best parallel for these stylized islands (including the dots) is the 1313 BNF Atlas by Petrus Vesconte (early XIV Century).
In conclusion, the objects in the lower part of the diagram may well be islands and archipelagos represented in a uniformly stylized way.
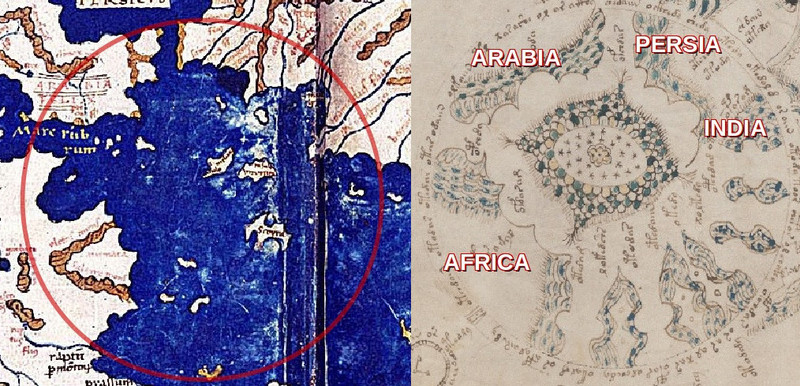
The Indian Sea In order to make use of the labels on the “map†to validate and possibly extend the phonetic analyses presented on this site, it is necessary to relate the map to a specific region. Unluckily, the orientation of the map cannot be considered conclusive, since in the XV century maps with different orientations were still produced; moreover, it is not completely clear what the “top†of the diagram is: the orientation of most labels suggests that the “top†is the left side of the page. It seems that this “map†represents a sea area surrounded on three sides by masses of land. The three regions define two more or less orthogonal straits of similar width silent text. The best match that I could find for this configuration is the Indian Sea as it appears in the 1489 Century“Martellus†(Hammer) map. The main difference with the Voynich diagram is that the Martellus map only has small islands, the larger of which is “Scoira†(Socotra). The orientations of the two maps seem to be almost perfectly aligned. Also a large gulf on the Eastern shore (the gulf of Cutch) has a good visual parallel in the Voynich diagram.
Another good parallel is the 1448 map by Walsperger. In this case, the coasts of Africa, Arabia and Persia/India define a square Indian Sea as in the Voynich map. The islands are larger than in Martellus map. The general orientation of the map has South at the top. This particular area has an incorrect orientation: the Arabian coast (that should face South) faces East surrogate driving icon.
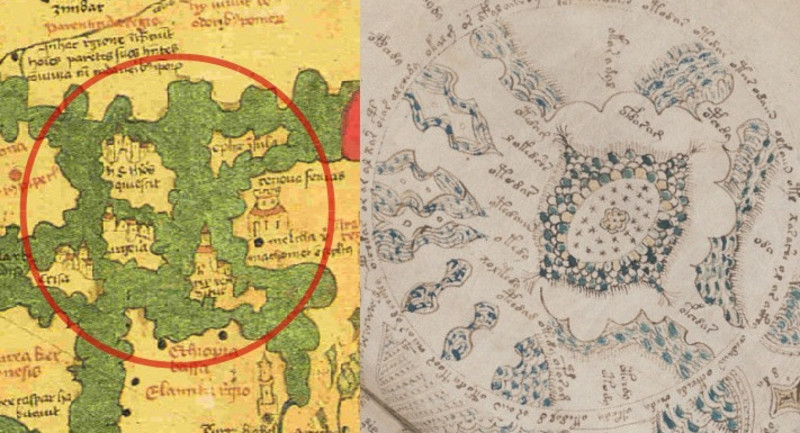
Walsperger’s world map is partly similar to the XII Century circular world map by al-Idrisi, which also compares reasonably well with f86r diagram (but the three main lands do not form a square as well defined as in Walsperger’s and Martellus’ maps).
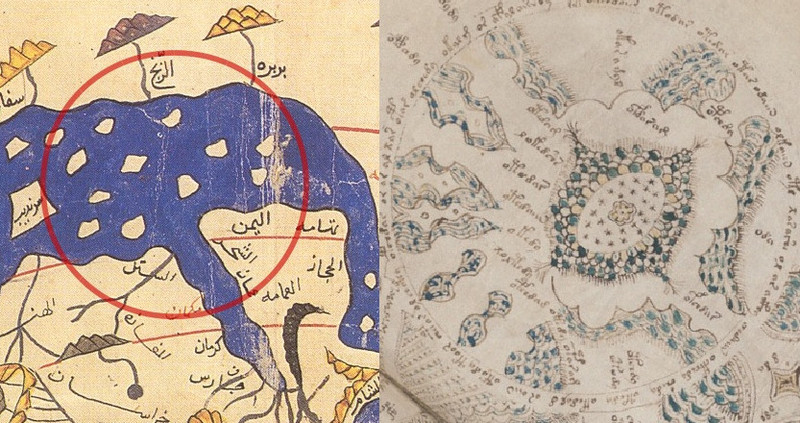
With reference to the stars surrounding the central “flowerâ€, Steinglass’ Persian Dictionary says that the expression “darya’i akhzar†(literally “the blue seaâ€) can mean both “the Indian Ocean†and “the skyâ€.
Other candidate regions The map could well be intended to represent a region different from the Indian Sea. Using modern maps, candidate areas could be the northern Red Sea (Egypt, Sinai, Arabia) or the Baltic Sea (Sweden, Finland, Estonia), just to make a couple of examples.
The labels The following is the list of the labels as numbered and transcribed on voynich.nu. In a few cases, I propose an alternative transcription in square brackets. I have added transcriptions for the four labels outside the circle but near the islands, numbering them 16-19 Fort Nabaron. I also provide tentative identifications for labels #3 and #15, in the hypothesis that the map represents the Indian Sea.
1 EVA:opdaram [ofdaram] (reading: abturu?)
2 EVA:otedam (reading: alotu?)
3 EVA:lokedshs (reading: shakot?s). This label (corresponding to the leftmost “island†in the diagram) could refer to Socotra. In the Tabula Rogeriana by Al-Idrisi (1154), it is called “Sokotraâ€. In the Dourado Atlas Huntington Library HM 41 (probably written in Goa in 1570 ca) the island is called “Sacotoraâ€. https://www.pinterest.com/pin/518265869594341963/
4 EVA:otodar (reading: alatur?)
5 EVA:otedaiin [ytedaiin] (reading: alotu? / nlotu? / ulotu?)
6 EVA:okedy (reading: akotn? / akotu?)
7 EVA:loltedy [?oltedy] (reading: shashlotn / ?ashlotn)
8 EVA:opedam [opeedam] (reading: abootu?)
9 EVA:opchdar [ofchdar] (reading: apytur?)
10 EVA:opchdy (reading: abytn?)
11 EVA:oda (reading: atu)
12 EVA:okar amal (reading: akur u?ush)
13 EVA:otchdy-{ring}chdain- [otchdy shdaiin] (reading: alytu ytu theatrical version of Pokémon? / ?tu?)
14 EVA:otady-{ring}ote*y [otedy otemy] (reading: alutn ato?n)
15 EVA:otedy oparam [otedy oparam] (reading: alotn aburu?). The second word of this label could refer to the city of Bharuch in North-West India. The label corresponds to  the area that Stolfi / Zandbergen call “a streamâ€. The “stream†could be the Gulf of Khambhat and the mouth of the Indus river. The Tabula Rogeriana by Al-Idrisi (1154) has a city named “Barug†in West India. Ptolemy and the pseudo-Arrian called the gulf “Baracesâ€. The 1492 map by Johannes Schnitzer calls it “Sinus Baragaâ€. In the Dourado Atlas, Huntington Library HM 41, the city is called “Barocheâ€
16 EVA:ofodydy (reading: apatntn)
17 EVA:opdady (reading: abtutn)
18 EVA:otodey (reading: alaton)
19 EVA:otodedy (reading: alatotn)
Problems These are a few “open problems†with the hypothesis that the diagram is a map. I do not think that they are so serious as to suggest that the hypothesis should be discarded, but it would be nice to solve at least some of them. The coastlines present a few dubious features: The gap at the right that Stolfi / Zandbergen call “a stream†Wayback download. The profile of the central “island†(which is not closed at the top). I assume that the pattern that fills part of the “land†areas represents mountains. But I was unable to find examples of mountains represented in the style we see here. Do manuscript maps with similar mountains exist? The central “flower†is unexplained. It occupies the place in which a compass would be found, in a more formal map. What is the meaning of this feature? Does it mark the center of the sea or does it correspond to an island? Does anything similar exist in other manuscripts? Finally, I could not find examples of similar circular maps (excluding world maps), in particular maps included in larger diagrams.
Marco Ponzi April 2015
1 Comment